You can beat efficient markets through management. A stock in an efficient market spends 85% of its trade in a price range. At the edges of the range it has like a 60% chance or so of reverting to the middle of the range. But to remain efficient the downside if you bet on a reversion is greater than if it doesn’t. Alternatively, the majority of the traders can just be wrong and exposed to a move in either direction and eventually the market is the market with emotional swings to correct price. Oversold become extended bear markets and rare collapses, overbought become explosive bull market breakouts. If you have an equal upside to equal downside or equal holding period in time, a 60% chance of an equal risk/reward is profitable.
Alternatively, if you take an outlier and let it run long enough and manage the stops, you can make enough money in the 15% of stocks that don’t stay in the range if you let it run long enough to offset all the losses and cut the losses short.
You can also beat a random market over time with equal allocation and rebalancing by benefiting from the volatility. The idea that you can’t beat an efficient market is probably a little bit wrong. You can certainly profit from one. Either the market is random and positive profit beats it, or it is not, in which case there are patters no matter how complicated, complex or how much statistical noise you add.
https://thepfengineer.com/2016/04/25/rebalancing-with-shannons-demon/
More risk doesn’t equal more reward
In fact, diversification among multiple assets with the least risk per asset beats concentration into a single asset (if each asset has equal probability and edge).
Options can be used to create a lot of different kinds of bets including a 50/50 chance (according to option pricing) of an up or down move. This offsets time and price so that at the end of a period if it’s above a price you make $5 a share no matter how far above that price it is and if it’s below a price you lose $5 a share no matter how far below it is. This strategy can boost high probability strategies where you have a 60% of a directional move but a 40% move of a disproportionally large move.
Alternatively, you can take a strategy where you make a huge amount if it goes over a particular amount, but offset your loss by costing nothing if it doesn’t go down by a slightly less huge amount, with that max loss capped at less than the max gain. This would be good if the probability of a huge move is mostly limited to a single direction.
You could also use options to gain from non directional move and/or from time decay when a stock doesn’t move a particular direction.
Options market can still be efficient in the way it’s priced, but it’s designed to be priced 50/50 chance of up or down move and only the magnitude of direction changes. Stock market can still be efficient in that it stays within price range and yet does so in a somewhat predictably directionally biased way. Combining the two can make for profits from smart traders.
Fundamentals, qualitative, sentiments, cyclical, technicals.
Fundamentals determine what you are buying. What are assets on the book. Fundamentals are compared to the cost. For instance, a company with 2billion in cash, one billion in debts would have book value of 1Billion. If it has a billion shares trading at $1 per share it’s fairly priced. If it is trading at $0.50 per share it is underpriced with a “market cap” of 500M. If it is trading at $2 It is overpriced with market cap of $2 billion. Those assets are tied to what the company is, what it can earn, how it can survive, and whether or not someone is going to come along, buy out the entire company, liquidate the assets, pay off the debts and return the money to shareholders. Additional “intangible” valuation depends on the qualitative.
Qualitative estimates the intangible value. A good sign of quality business is one that is self funding, that doesn’t need to pile money into factory, plant and equipment just to keep up. A good quality business is one where it has a premium brand, intellectual property protects it, competitors have tried and failed to overtake its status, it has a cultlike following, it creates new products and it creates new customers and expands from local to state to national to global. It has declining costs (what company pays) and increased price (What customers pay), it has high referral rates and word of mouth effect, it has premium products that people will always pay for, it can maintain both a premium brand as well as make alternative economy products to expand customer base with discount option. It has regular income. It bennefits from being the go between of multiple businesses or consumer monopoly or both. These are some hallmarks of quality company.
Sentiment
There are two types of sentiment. Sentiment of the public (those buying stock) and of the forecasters. When everyone buys who is ever going to buy and all capital that ever is going to be allocated is in, the slightest bit of selling pressure or reduction in buying power and cause the stock to decline, particularly if volume is really top heavy. Markets have to top on optomism and overbuying and bottom on Liquidation or pessimism and forced selling.
All sorts of cycles exist in nature that drive human behavior. That’s a bigger topic but people’s mood change based on sun, they gravitate towards food which is governed by the sun, and it’s no surprise solar cycles correlate with recessesions, or why when humans have evolved to become less dependent upon farmland and the sun for food why it may gravitate away from that correlation and towards the debt cycle which is a kind of sentiment cycle of debt and credit. Cycles form by optomism of business participants and earnings forecasts as Well as debt cycle.
When businesses want into a particular market, they have to pay for it. Supply/demand rules the day. When demand to get into an industry is hot, people tend to overpay and overborrow based on promise of returns due to history of growth, that causes overpaying of price, over competitive markets that drive down price and margins and drive up costs and lead to liquidation and declining industry interest which eventually leads to the opposite side of the cycle. Disruptions and fire sales of assets or forced selling due to overleverage requiring sale of assets lead to distressed asset prices which cause others to have insane debt/equity which requires additional forced selling, which eventually rids the market of competition and allows for low price that is precisely what leads to great future returns, converts debt to an asset, expands margins and reverts the cycle until it attracts new set of customers and leads to herding which makes the business competative.
Price of a stock isn’t always directly correlated with value. When credit is tight, and few people are interested in stocks, smart money rules the day and they tend to anticipate some to a lot of this stuff. When the crowd is involved, price becomes king over value, algorithms of smart money feed off the short term movements of price, and market becomes detached from value. That to creates cycles in price as well.


So, cycles is a big part of understanding the market. Not all stocks are cyclical, some are only slightly levered to other cycles like the debt cycle, some are massively levered to the cycle. It’s important to know which one if you are going to use fundamentals, as nearly all fundamentals should be discounted, possibly even to the point of being precisely inverted at particular times. For instance, In 2009 real estate and banks had negative book value precisely at the bottom, the market had worst earnings ever aNd some of the best returns from the bottom were those with the worst possible fundamentals that didn’t go bankrupt. There is a reason for that, the stocks were highly levered to their “extrinsic value” or the potential for assets to move significantly higher as bankruptcy was mostly priced in and assets were eventually to become way more valuable than whatever was on the books, despite peple noticing the opposite trend at the time. The historical earnings that the market eventually reverted to resulted in companies that seemed totally unviable and undesirable at any price to recover and become legitimate businesses that just knocked out most of its smaller competitors who couldn’t make it, allowing them to gobble up market share and their massive levels of debt to small levels of equity to become an asset.
It’s difficult to say just how much the asset prices will “revert” and how far they are from the mean and just how much to discount fundamentals unless you really know the industry and the cycles, but you will be ahead of a lot of people if you focus on distressed industries and consider some margin of safety.
A company’s “book value” discounted to whatever it can be liquidated for at market price determines how much a company is worth “dead”, whereas the ability to convert a small amount of book value into a high amount of earnings and the future earnings power of the company or even the future growth of earnings multiplied by the multiple enthusiastic investors will be willing to pay later is what it is worth “alive”. Extrinsic value may also include things that aren’t obvious, mostly related to quality. Can it innovate products? Can it grow and expand its market? Will It be able to reduce costs over time or increase prices to customers? Or will it be the opposite and costs will increase? Can the company leverage strategic buyouts or joint ventures to immediately multiply its value? For instance, can a conglomerate like Berkshire Hathaway buy a company like Google and use its search engines to reduce advertising costs for its consumer products and increase business of Google at the same time for a win/win relationship?
Technicals have some value, but are more about matching a management style with an entry style. A mean reverting strategy works to the degree you manage your exits so that you have an equal holding period in duration or Roughly equal target and loss levels, or allow for diversification and strategic asset allocation. Alternatively a momentum style can help you manage risk such as using a moving average for an exit plus or minus 2 ATR(2 periods of average movement of the stock) whee you allow winners to run until they run out of momentum and the idea stop workings, the outlier moves pay for the frequent losses.
Aside from that, system based thinking can take market conditions and align them with style.


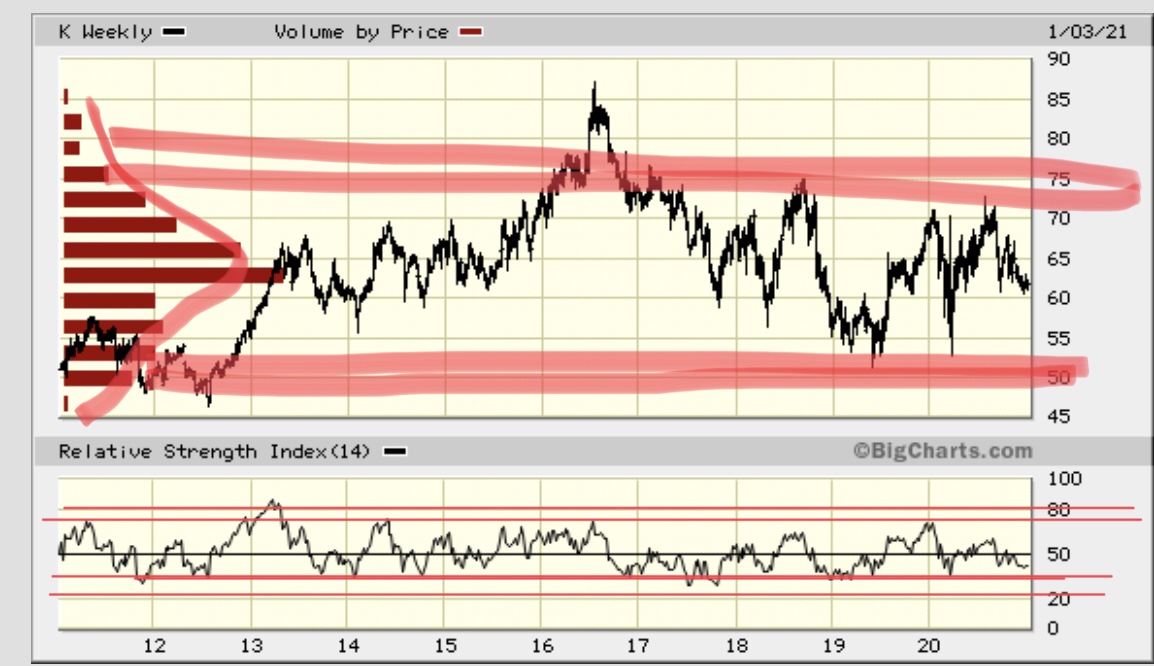
Some styles do well “in phase” but poorly “out of phase”, others do relatively well in all conditions but tend to do less well in certain conditions, some do well in some phases but not in others. Some relatively trade with the market, others tend to not be impacted by the market. Some trading styles are more effected by volatility (or lack of volatility), trend strength (or lack of), or rotation of capital (or lack of) than price. The best trading system using technicals pair the strategy, the time frame, the allocation/risk, the trading vehicle(s) and the market conditions. Most backtesting fails because they are based on all sorts of details that aren’t repeatable based on a specific kind of market that dominated. If you want to backtest, correlate the conditions (what the signal tells you the market is doing now) with the strategy. You could use a simple mechanism like monthly MACD to determine S&P direction in a bullish crossover (bullish condition) or bearish crossover (bearish) or 50 day Ma Vs 200 day moving average. And other things like volatility index below 15 or above 25 or in between for volatility low, high, or medium. Then you can pair the strategy with the condition and try it again using shorter time frames to see if the signal is as robust. You might test a “mean reversion” concept for the market conditions it works best in with an RSI and then use a different signal when you actually trade it. You are looking for general simplistic concepts to see what works when. When it comes to actual trading it’s more about what you believe and can execute that falls within that concept and aligns with market conditions. It’s hard to backtest “volume profiles” and they are a bit more intuitive/discretionary. But if you plan to trade by buying low end of the range and selling the high or middle during mean reverting markets. or by trading at the middle of the range below a thin volume profile or volume pocket during range expansion or in anticipation of breakout during conditions where momentum trades are likely to stick, you can do that even if you used a MACD or RSI for Backtesting. There was a long period of time where people swore by the 28 day RSI indicator and now that stopped working and the 5 day RSI began working, that may be the result of algorithmic trading scalping momentum in the short term and before that reduction of trading fees (costs) leading to shorter duration trading becoming more viable, or Moe crowd participation and financial network consisting of everyday news and headlines leading to greater short term emotional swings. I’m not sure. But the concept of mean reversion never stopped working and if you chased the backtested performance of the 28 day instead of something you could be effective at in the right conditions, you might have struggled. Moral is, stick to concepts you can personally trade well and backtest only to align conditions with strategy, not curve fit the exact method to use.
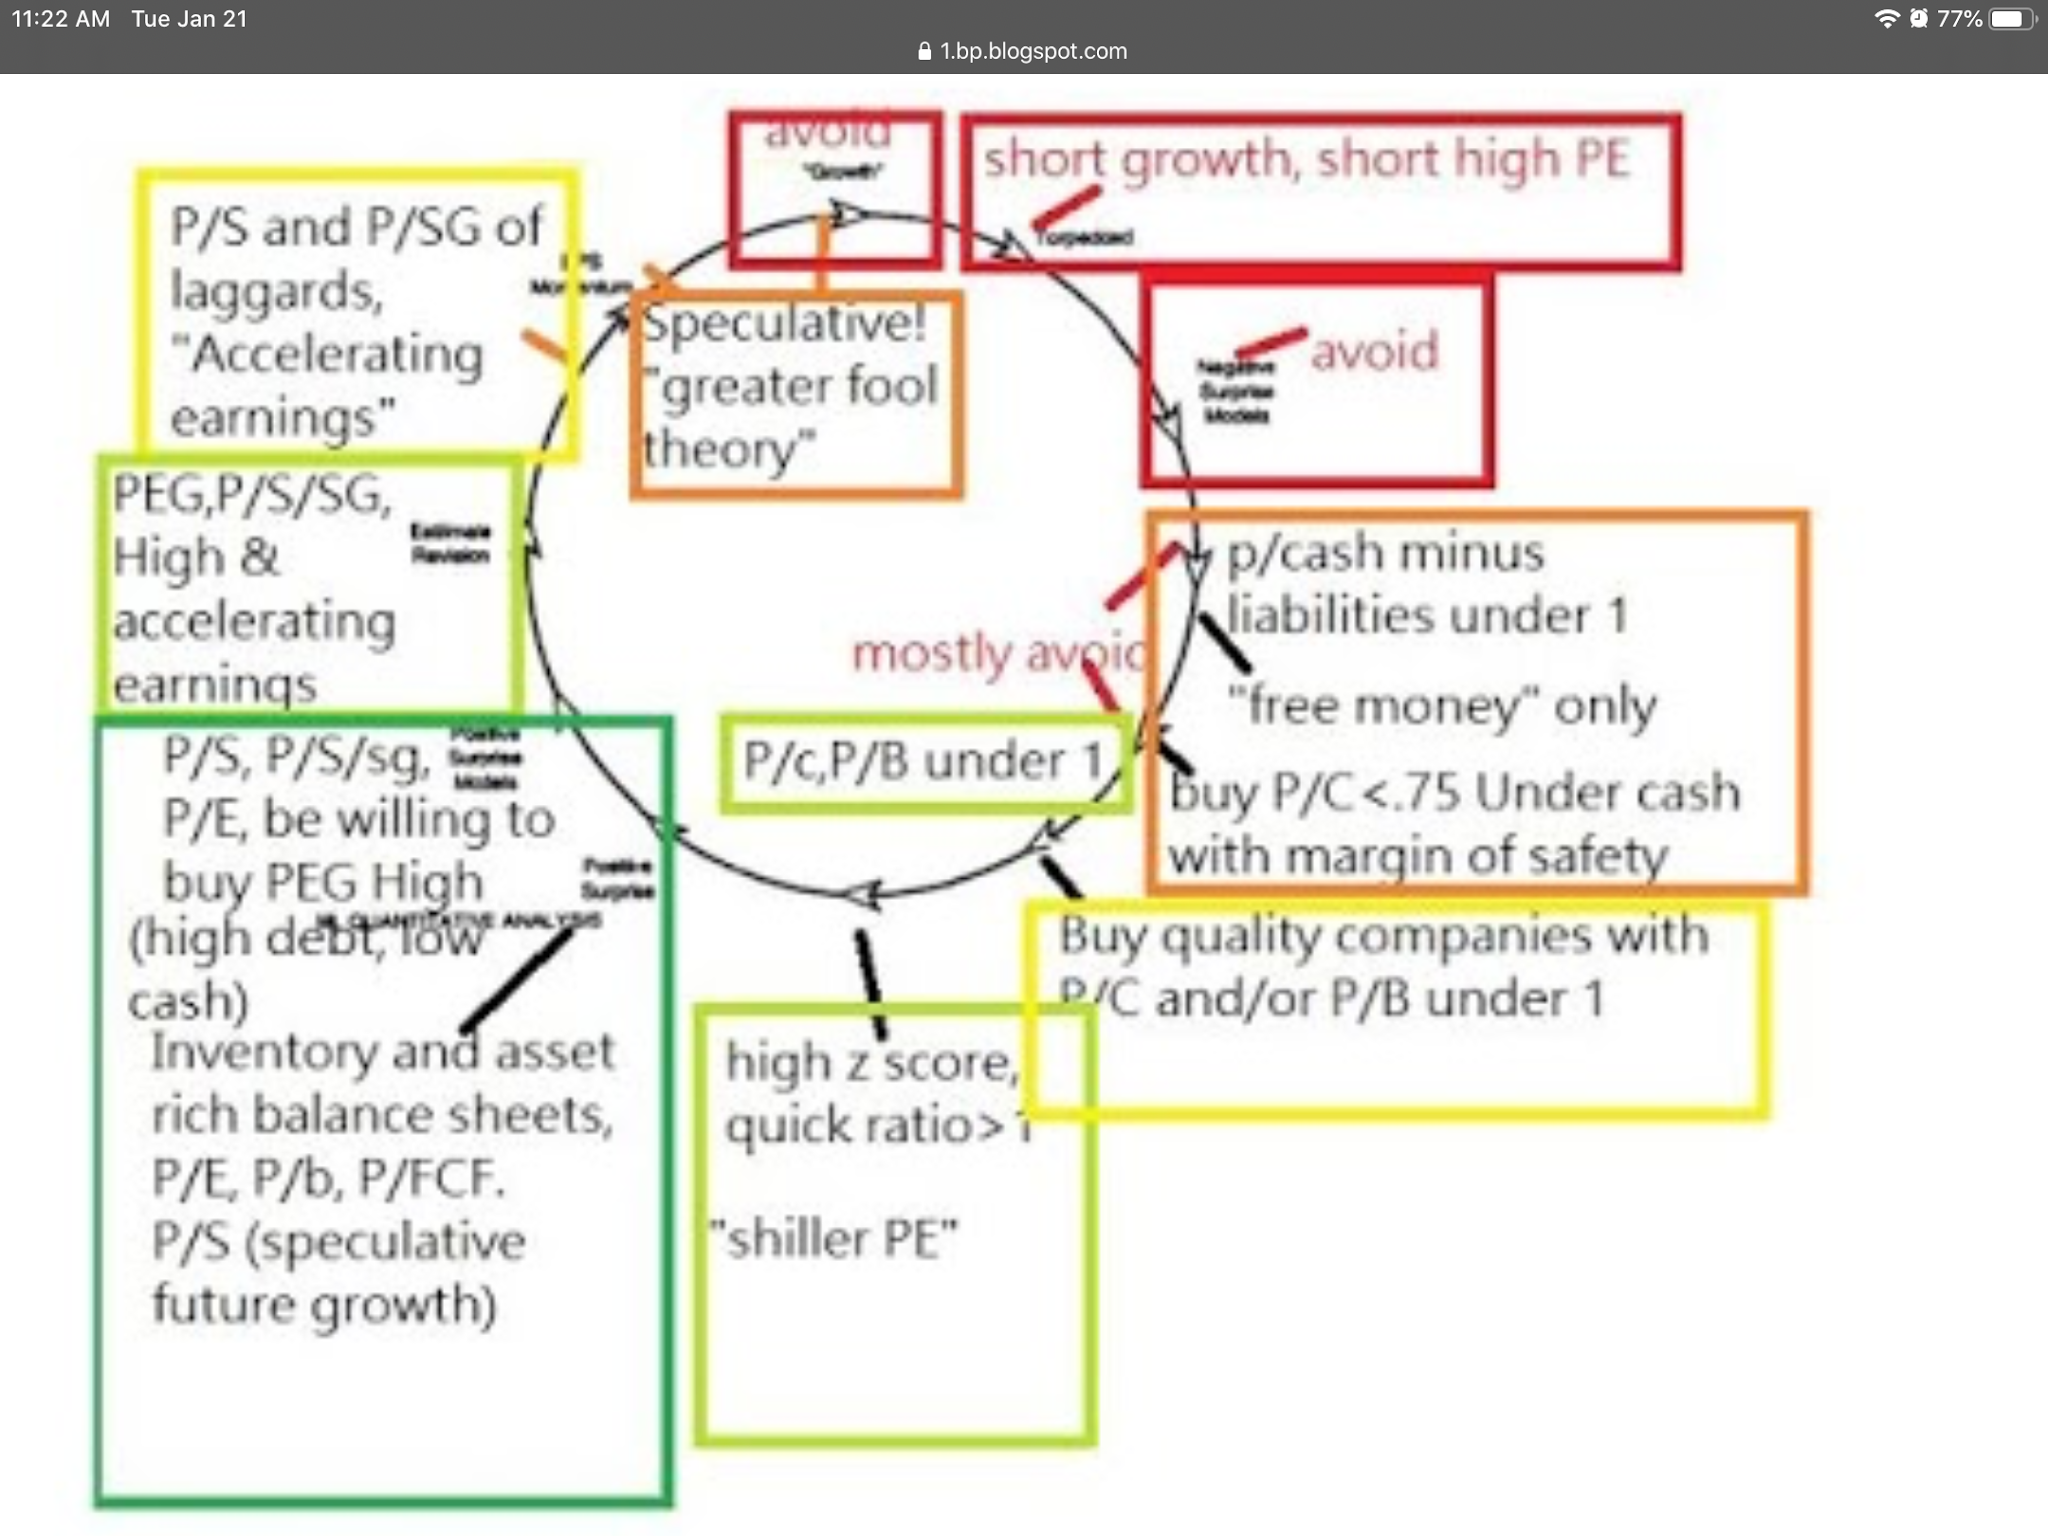
Algorithmic trading
Thee ae cheap trading platforms today that can run on “if-then-else” programming logic, “if this indicator is oversold AND these conditions are met, then do this, otherwise don’t”. Such algorithmic trading can allow for crisp precise execution of rules that takes emotion out of the equation. There are a lot of different sound trading logic, but most are some combination of momentum (Growth), reversion (contrarian) and neglect (value). Momentum relies on a few outliers continuing well beyond typical range. (Stocks that go uo 1500% have to go up 100% first) Reversion relies on management to “normalize” the range either over hundreds of trades or fixed holding periods, (Stocks overreact to price movement and then “normalize”) and neglect looks to buy low volatility rangebound stocks at lower end of the range and anticipate a range expansion or “breakout” before the momentum traders. You can also do simple game theory type trading that looks for a portfolio with minimal correlation overall and balance and uses rebalancing/allocation to profit from strong directional capital flows. An example is the “permenant portfolio” of 25% cash, 25% gold, 25% stock, 25% bonds where you adjust if any allocation falls below 15% or above 35%. An algorithmic strategy might rebalance a lot more frequently during range bound volatile conditions and rebalance less frequently during high trend strength and low volatility conditions (that lead to breakouts)