I had a long post on this but somehow it didn't save as it should have. This will be shorter than the original, but I still believe I have most of the initial images.
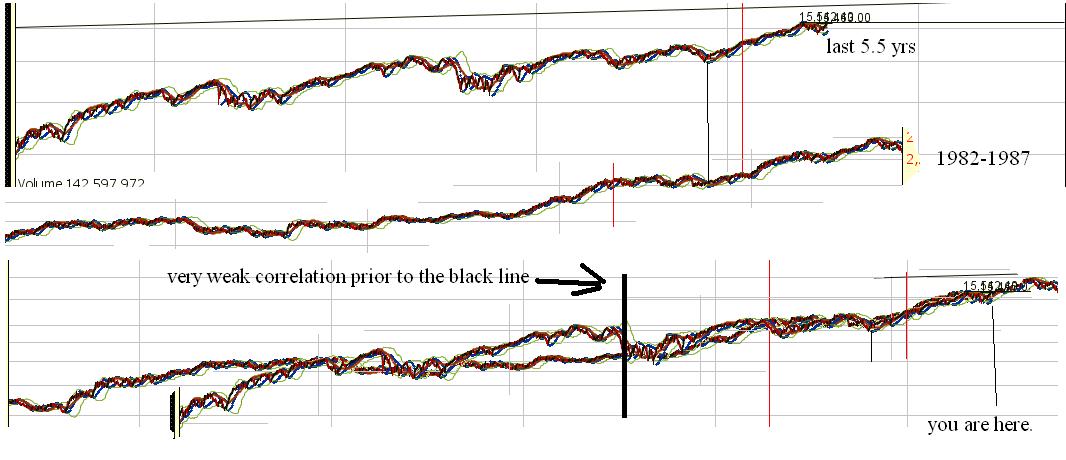
"Analogs" are basically using the past to see if the present matches up with it. If you use a 1987 analog, you are basically expecting the market to behave similarly to as it did back then. Analog trading requires some understanding of psychology and the events that occurred at the time. It requires an understanding of debt markets and what drives the particular settings.
To trade via analogs, you first must identify the time periods that the market behaves similarly. Once you identify the past as similarly you go forward in the future looking for similar results.
Sometimes the charts will diverge, and either the trend will be broken, or else you could see a convergence of trends again. It often will be difficult to tell if the trend has just diverged, or if it permanantly broke the relationship. So you have to understand the fundamental nature of the market and determine if laws were passed anywhere in the world that may permanantly effect capital flows. Perhaps there is a crash that permanantly effects the flows of capital, or a break of suppor/resistance. Analog trading isn't enough on it's own, but can serve as a guideline.
Another thing you can do to use analog trading is look at "presidential cycle" and Seasonal data as well as the 10 year cycle and perhaps secular data (that averages beginning to end of each market cycle). Or you can take all analog's record the daily, weekly, or monthly prices open, close, high and low and line them up with the time period looks best and take the and average them together in excel or something, then plot them in a graph form next to the current "cycle". You can basically use the same method mentioned in the post that teaches you how to create your own seasonal charts. Only gathering historical data for a time period back to the 1900s may be difficult. you may have to do this manually.
At any rate, using this information may give you guidelines that help tune up your "market bias" and position your portfolio accordingly.
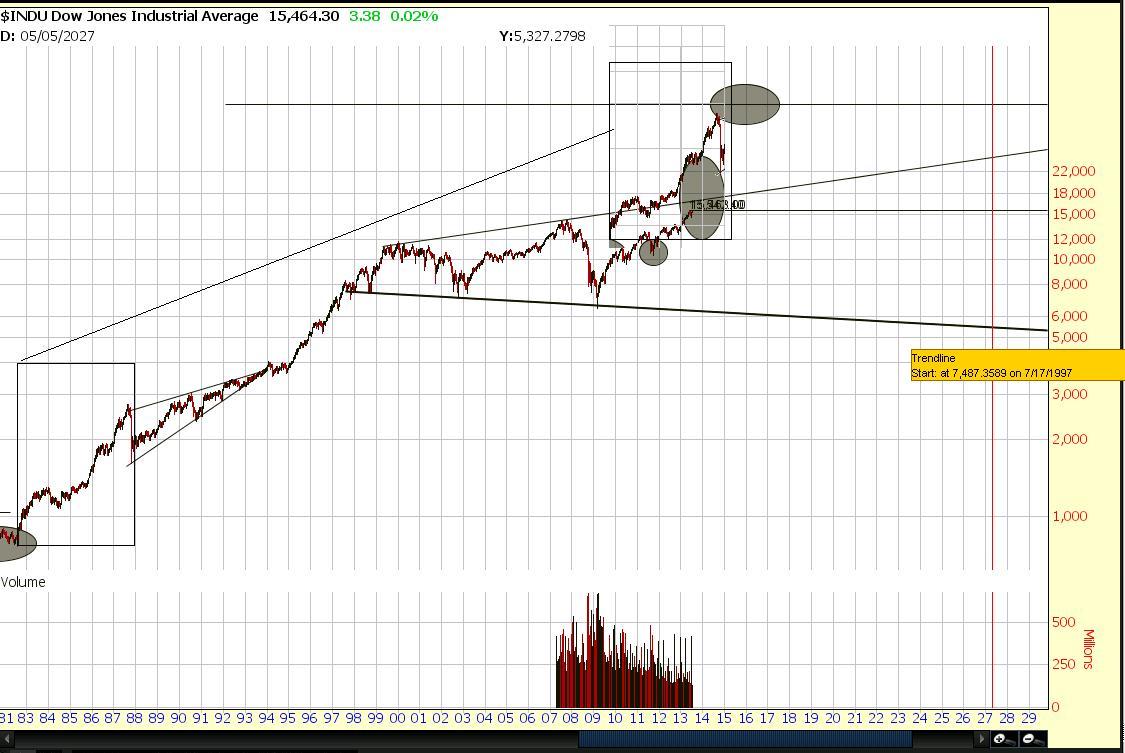
yearly chart
You can use this information to determine targets, maximum targets, average targets, upside vs downside targets and determine a "risk" vs reward, and based upon the number of analogs determine the amount that line up and estimate a probability of each event, and use it to manage risk and position yourself according to probability and edge, and provide extra cash for uncertainty.
You can apply this knowledge to combine it with other charts that perhaps look at earnings and future earnings estimates of the companies on average, historical PE averages and things of this nature to match the fundmental picture. You can also use technical analysis as well and combine all the information you can weighted by how valuable the analysis is or how accurate you beleive it to be.
The accuracy rate is important, but so is predictability and "sample size" and "confidence" that the particular indicator or method will provide you with reliable signals. Unfortunately, people using intuitive "confidence" tend to be optomistic at the wrong times, so unless you have a history of making judgements that can be proven statistically or past statistics, or have a strong reason to believe the stats will diverge, you probabl won't find a ton of value off just guessing.
Regardless, put "analog" trading into your arsenal. Depending on how we look after we get past September and perhaps October, or as early as mid August, I could potentially change my outlook to dramatically bullish or bearish. We could line up with the 1987 crash soon, and September has the budget ceiling and elections in Germany that creates risk.


No comments:
Post a Comment